Free tool · support and resistance levels
Pivot Point Calculator (Classic, Fibonacci, Camarilla)
A pivot point is the average of the previous period's high, low and close: (H + L + C) ÷ 3. Traders mark it, with the resistance levels above it (R1 to R3) and the support levels below it (S1 to S3), as reference levels for the current day or week. Price above the pivot is usually read as a firmer tone, below it as a softer one.
Enter the previous period's high, low and close to get pivot points under all five common methods. Today's XAUUSD pivot points, plus EUR/USD and GBP/USD, are filled in from yesterday's and last week's closed candles. Free, no sign-up.
Pivot points
| Level | |||||
|---|---|---|---|---|---|
| R4 | — | — | 4,093.10 | — | — |
| R3 | 4,227.32 | 4,184.99 | 4,059.62 | 4,208.76 | — |
| R2 | 4,184.99 | 4,138.48 | 4,048.46 | 4,175.72 | — |
| R1 | 4,105.57 | 4,109.75 | 4,037.30 | 4,087.01 | 4,084.40 |
| P | 4,063.24 | 4,063.24 | 4,063.24 | 4,053.97 | 4,052.66 |
| S1 | 3,983.82 | 4,016.73 | 4,014.98 | 3,965.26 | 3,962.65 |
| S2 | 3,941.49 | 3,988.00 | 4,003.82 | 3,932.22 | — |
| S3 | 3,862.07 | 3,941.49 | 3,992.66 | 3,843.51 | — |
| S4 | — | — | 3,959.18 | — | — |
R = resistance above the pivot, S = support below it. DeMark appears when you enter the open. Reference levels, not predictions.
How to calculate pivot points
Every method starts from the previous period's candle: yesterday for daily pivots, last week for weekly pivots.
| Method | Pivot (P) | First levels |
|---|---|---|
| Classic | (H + L + C) ÷ 3 | R1 = 2P − L, S1 = 2P − H |
| Fibonacci | (H + L + C) ÷ 3 | R1 = P + 0.382 × (H − L), S1 = P − 0.382 × (H − L) |
| Camarilla | (H + L + C) ÷ 3 | R1 = C + 1.1 × (H − L) ÷ 12, S1 = C − 1.1 × (H − L) ÷ 12 |
| Woodie | (H + L + 2C) ÷ 4 | R1 = 2P − L, S1 = 2P − H |
| DeMark | X ÷ 4 | R1 = X ÷ 2 − L, S1 = X ÷ 2 − H (X depends on close vs open) |
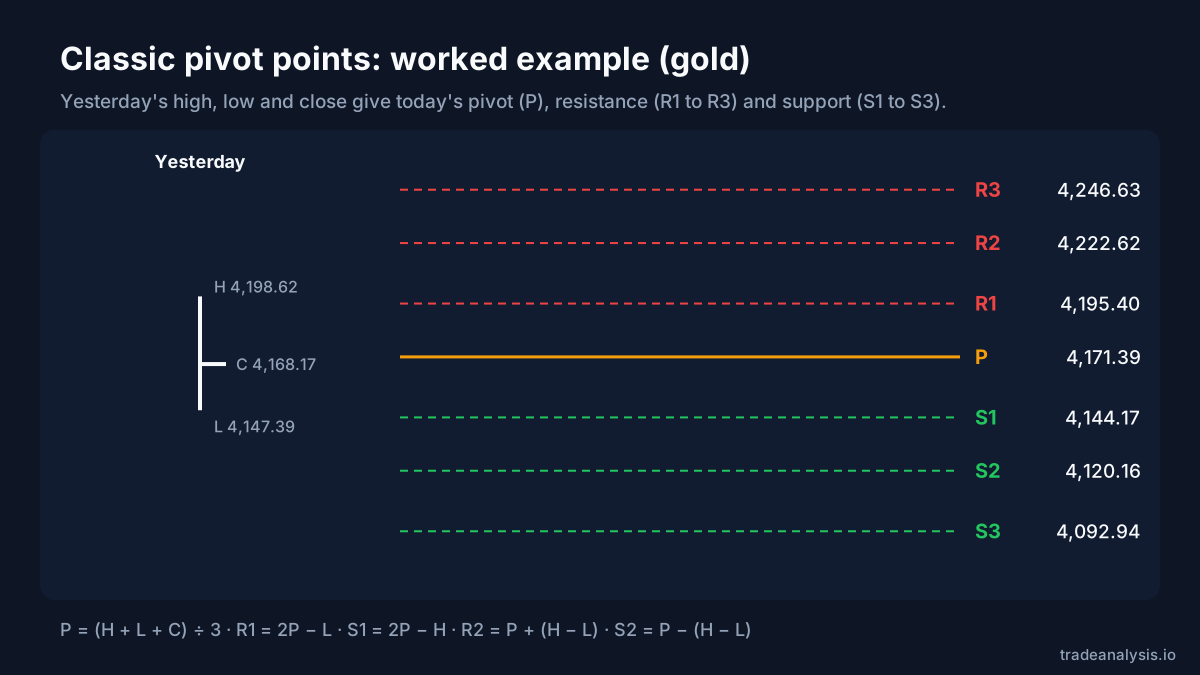
Worked example (gold): with a previous day high of 4,198.62, low of 4,147.39 and close of 4,168.17, the classic pivot is (4,198.62 + 4,147.39 + 4,168.17) ÷ 3 = 4,171.39. R1 is 2P − L = 4,195.40 and S1 is 2P − H = 4,144.17 (worked from the unrounded pivot, 4,171.3933).
Camarilla pivot points
Camarilla pivot points are built around the previous close rather than the pivot, so they sit much tighter to price than the classic levels. A common convention treats R3 and S3 as levels to fade back toward the close and R4 and S4 as breakout levels, which is why Camarilla pivots are popular with intraday traders.
How traders use pivot points on gold
Intraday traders mark the daily pivot and the first support and resistance before the London open. Price opening above the pivot is often read as a firmer tone, below it as a softer one, and R1 or S1 as areas where a move may pause. On gold these levels often line up with the previous day's high and low, which are the same places liquidity sweeps happen.
Our bots don't use pivots. They work from the previous day, week and month highs and lows and the Asian range, listed with live sweep status on the gold analysis page. If you do trade a pivot level, size the position from your stop with the gold lot size calculator.
More free trading tools
Pivot point calculator FAQ
How are pivot points calculated?
What is the difference between Classic, Fibonacci, Camarilla, Woodie and DeMark pivots?
Why are my broker's gold pivots slightly different?
Do pivot points work?
Educational, not financial advice. Trading involves risk of loss.