XAU/USD · levels and setups
Gold Analysis Today (XAU/USD)
Today's read
· next update 14:30 UTC
- Gold is below its 4-hour, daily and weekly 50 EMA.
- It swept the Asian session high (4,032.26) at 11:15 UTC and closed back below it.
- Nearest untouched levels: 4,142.67 above (previous day high) and 3,987.72 below (Asian session low).
4,024.52Last close, 15-minute chart
- 4-hour trend: below its 50 EMA
- Daily trend: below its 50 EMA
- Weekly trend: below its 50 EMA
Educational, not financial advice. Trading involves risk of loss.
Scalper is watching a SELL area. Sign up free to see where.
The zone, invalidation, TP1 and TP2 of every setup are shown to signed-in users. A free account is all it takes, and new setups appear the moment they're posted.
Sign up free for the next setupNo card needed. Already have an account? Sign in
Today's gold analysis shows where XAU/USD is trading against the levels that matter this session (the previous day, week and month highs and lows, and the Asian range), which of them price has swept, the latest structure breaks, and the reaction areas our rule-based bots have posted. It updates several times each weekday. These are levels and rules, not a price prediction.
Gold last closed at 4,024.52 on the 15-minute chart. The 4-hour trend is below its 50 EMA; the daily trend is below it and the weekly trend is below it. Price swept the Asian session high (4,032.26) at 11:15 UTC and closed back below it. That makes 2 level sweeps today. The latest 15-minute structure break was a bullish change of character (CHoCH) through 4,028.68 at 11:00 UTC. Today's range so far is 3,987.72 to 4,033.17. 6 reaction areas were posted in the last 36 hours, 2 still open.
Today's gold setups
Reaction areas the bots posted for gold in the last 36 hours, newest first, with the tracker's live status.
Stop hit (−1R)
Posted 02:16 UTC (10 h ago) · closed 05:40 UTC
TP1 reached (+1R)
Posted 02:03 UTC (10 h ago) · closed 05:40 UTC
Waiting for price to reach the zone
Posted 18:31 UTC (17 h ago)
TP2 reached (+2R)
Posted 08:03 UTC (22 Oct) · closed 11:20 UTC
Waiting for price to reach the zone
Posted 03:46 UTC (22 Oct)
TP2 reached (+2R)
Posted 00:46 UTC (22 Oct) · closed 03:05 UTC
Results are per-area outcomes from our tracker (TP1 = +1R, TP2 = +2R, stop = −1R), not a performance claim. Past results don't predict future ones.
Gold live chart (XAUUSD)
The XAUUSD live chart below shows the live gold price on the 15-minute chart. Compare this XAUUSD chart with the levels and areas on this page, or work out today's gold pivot points and Fibonacci levels for last week's range.
XAUUSD live chart
Chart by TradingView
XAUUSD technical analysis today: key levels
| Level | High | Low |
|---|---|---|
| Today so far | 4,033.17 | 3,987.72 |
| Asian session range | 4,032.26Taken | 3,987.72Untouched |
| Previous day | 4,142.67Untouched | 4,020.47Taken |
| Previous week | 4,216.21Untouched | 4,073.82Taken |
| Previous month | 4,511.00Untouched | 4,110.95Taken |
Taken: price has traded beyond the level today or is beyond it now. Untouched: neither.
Sweeps today
Previous day low swept at 4,020.47
00:45 UTC · 15-minute chart
Asian session high swept at 4,032.26
11:15 UTC · 15-minute chart
Latest structure
15-minute chart: bullish change of character (CHoCH) through 4,028.68
23 Oct · 11:00 UTC
4-hour chart: bearish change of character (CHoCH) through 4,106.88
22 Oct · 00:00 UTC
Daily chart: bearish break of structure (BOS) through 4,073.44
22 Oct · 00:00 UTC
Zones being watched
Sell zone 4,106.88–4,142.03
daily chart · untested · with the weekly trend
XAUUSD forecast this week: what the trend filters say
Not a price target. This is the direction of the daily and weekly trend filters the Advance Day and Swing bots use, and where last week's liquidity sits.
The daily trend is below its 50 EMA and the weekly trend is below its 50 EMA. Both point down, so sell setups are the ones trading with the trend this week. Last week's high is 4,216.21 (untouched) and its low is 4,073.82 (already taken). The latest higher-timeframe structure break was a bearish break of structure (BOS) through 4,073.44 on 22 Oct.
Gold technical analysis: how to read today's levels
This gold technical analysis is built from the same fixed rules our trading bots run, applied to XAU/USD. Nothing on it is a price target; if you came for a gold forecast today, the closest thing is the weekly section above, which shows which way the trend filters point. The page answers three questions a gold trader asks before the session: which levels matter today, which of them price has already taken, and where the rules say a reaction is worth watching.
The key levels
The previous day, week and month highs and lows are where many traders park stop orders, so they hold liquidity. The Asian session range is the high and low gold made in the quieter hours before London. When price trades through one of these levels and then closes back inside, that's a liquidity sweep: the stops above or below were taken and the move didn't continue. "Taken" in the table means price has already traded beyond a level today; "untouched" levels still have their liquidity resting there.
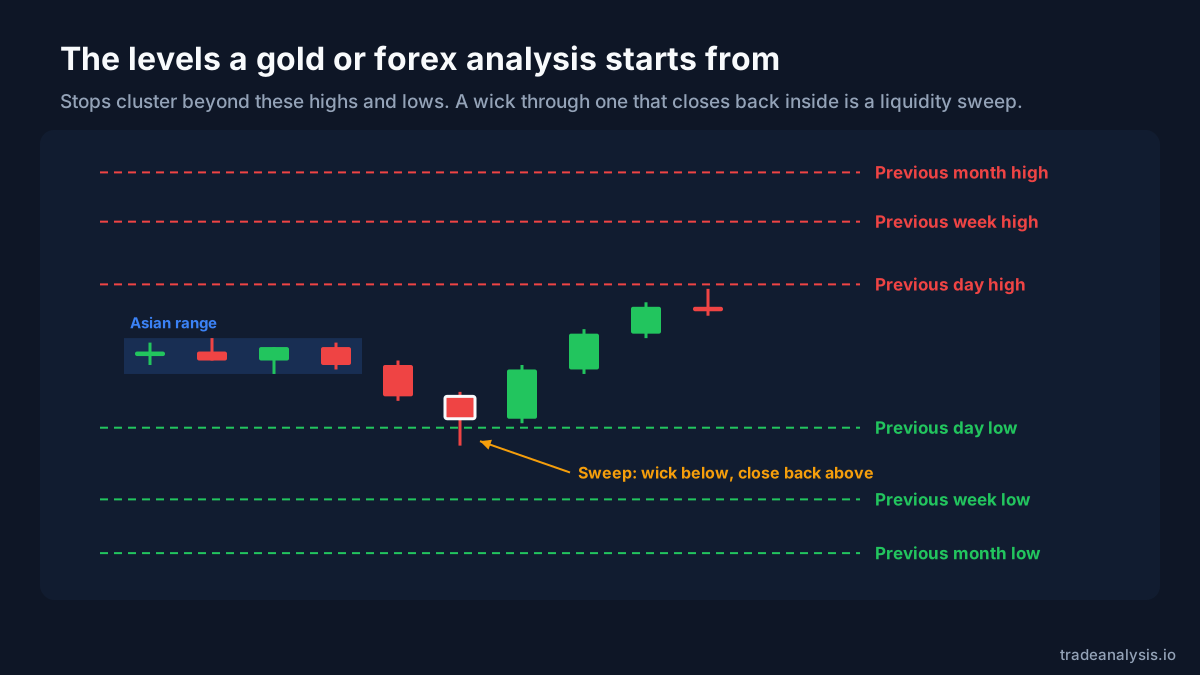
Each bot watches the levels that suit its chart. The Scalper (15-minute chart) and Basic Day (1-hour) watch the previous day and the Asian session, the Advance Day bot (4-hour) watches the previous day and week, and the Swing bot (daily) watches the previous week and month. Each follows a higher-timeframe trend filter: whether the last closed 4-hour, daily or weekly candle sits above or below its 50-period EMA. Those are the trend lines at the top of this page.
Why the London and New York sessions matter for gold
Gold trades almost around the clock, but most of its volume arrives when London and New York are open. The intraday bots treat 07:00–10:00 UTC as the London window and 12:00–16:00 UTC as the New York window. That's often when the Asian range or the previous day's high or low gets swept, which is why most sweeps in the list above carry London or New York times. The session times guide covers the hours in more detail, including daylight-saving shifts.
How to read a reaction area
A reaction area is an order block: the last opposite-coloured candle before a strong move, where price often comes back. The top tier, marked "sweep and shift", formed right after a liquidity sweep and a break of market structure. Each card shows:
- Zone: the order block's range, where the reaction is watched.
- Invalidation: the price where the idea is wrong. For top-tier blocks it sits just beyond the sweep wick; otherwise half an ATR beyond the zone. It's the stop the rules were tested with.
- TP1 and TP2: one and two times the risk, measured from the zone edge.
- Stars (1 to 4): one each for trading with the higher-timeframe trend, a first or second touch, and a sweep or liquidity level just beyond the zone.
Once an area is posted, a tracker follows it on live 5-minute prices. It shows "waiting" until price reaches the zone, then "in the zone". TP1 counts as a +1R win, TP2 as +2R, and a stop hit as a 1R loss. An area that expires before price reaches it is no trade. Losing areas stay on this page exactly like winning ones.
The full rule set, and how it was backtested, is on the methodology page. Backtests describe the past and don't promise anything about today's session.
Gold analysis FAQ
Is gold going up or down today?
Where is XAUUSD support and resistance today?
Is this an XAUUSD prediction for today?
How often is it updated?
Is this financial advice?
Can I get alerts?
More free trading tools
See the next gold setup when it's posted
A free account shows the zone, invalidation, TP1 and TP2 of every setup here the moment it's posted. Paid plans, from $4.99/month, run any bot on any symbol on demand.
Sign up freeEducational, not financial advice. Trading involves risk of loss.