Free tool · review your trading record
Win Rate Calculator & Expectancy
Win rate is the share of trades that win: winning trades divided by winning plus losing trades. On its own it doesn't say whether a strategy makes money. That depends on how big the wins are compared with the losses, which is what expectancy (the average result per trade) and profit factor (gross wins ÷ gross losses) add.
Count your winning and losing trades to get your win rate. Add your average win and loss and it works as an expectancy calculator too, with profit factor and the win rate you actually need. Use money or R; both work.
Win rate
45.0%
100 trades
- Payoff ratio (avg win ÷ avg loss)
- 2.00
- Win rate needed at this payoff
- 33.3%to break even, before costs
- Expectancy per trade
- +21.00in the same unit as your averages
- Profit factor
- 1.64gross wins ÷ gross losses
Win rate needed for each payoff ratio
Break-even win rate = 1 ÷ (1 + average win ÷ average loss). Above it a strategy makes money before costs.
| Average win ÷ average loss | Break-even win rate |
|---|---|
| 0.5 | 66.7% |
| 1.0 | 50.0% |
| 1.5 | 40.0% |
| 2.0 | 33.3% |
| 3.0 | 25.0% |
Why win rate alone can mislead you
Worked example: 45 wins and 55 losses is a 45% win rate. If the average win is $120 and the average loss $60, the payoff ratio is 2.0, the break-even win rate is 33.3%, and expectancy is (45 × 120 − 55 × 60) ÷ 100 = $21 per trade. Profit factor is 5,400 ÷ 3,300 = 1.64.
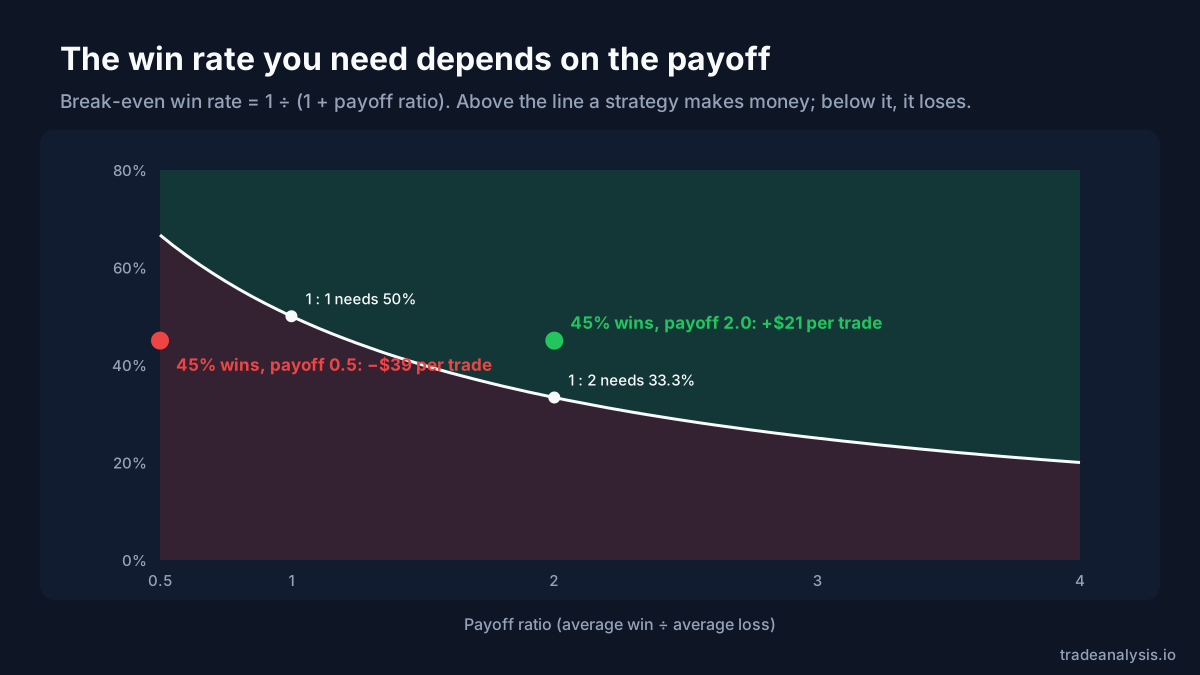
Flip the averages ($60 wins, $120 losses) and the same 45% win rate loses $39 per trade. That's why the calculator asks for both numbers: a high win rate with small winners can lose money, and a low one with big winners can make it. The risk reward calculator shows the same trade-off before you take a trade, and the drawdown calculator shows how long losing streaks at your win rate can run.
More free trading tools
Win rate calculator FAQ
How do you calculate win rate in trading?
What is a good win rate for trading?
What is expectancy?
What is profit factor?
Educational, not financial advice. Trading involves risk of loss.