DCF Calculator: Intrinsic Value of a Stock
A discounted cash flow calculator that works as an intrinsic value calculator: estimate a stock's intrinsic value per share by projecting its free cash flow, discounting it back to today, and adding a terminal value.
Free, no sign-up. Results update as you type. Enter cash flow, debt and shares in millions, in any one currency.
Result
Intrinsic value per share
35.85
- PV of forecast FCF
- 4,864.1
- Terminal value (Gordon growth)
- 23,170.2
- PV of terminal value
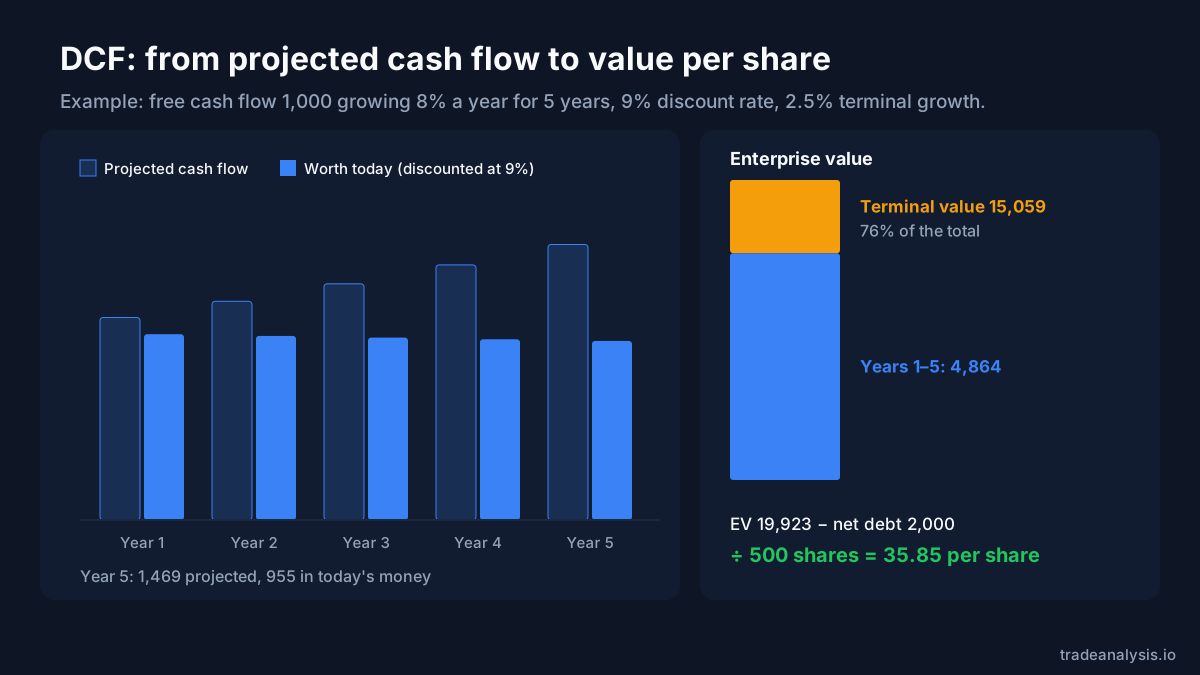
- 15,059.0
- Enterprise value
- 19,923.1
- Less net debt
- 2,000.0
- Equity value
- 17,923.1
- Share of value from terminal value
- 75.6%
Values in millions unless per share.
Year-by-year projection
| Year | Projected FCF | Discount factor | Present value |
|---|---|---|---|
| 1 | 1,080.0 | 0.9174 | 990.8 |
| 2 | 1,166.4 | 0.8417 | 981.7 |
| 3 | 1,259.7 | 0.7722 | 972.7 |
| 4 | 1,360.5 | 0.7084 | 963.8 |
| 5 | 1,469.3 | 0.6499 | 955.0 |
| Total PV of forecast FCF | 4,864.1 | ||
Sensitivity: value per share
Rows vary the discount rate, columns vary terminal growth. The highlighted cell is your current input.
| WACC \ g | 1.5% | 2.0% | 2.5% | 3.0% | 3.5% |
|---|---|---|---|---|---|
| 7.0% | 44.95 | 49.03 | 54.01 | 60.24 | 68.24 |
| 8.0% | 37.23 | 40.00 | 43.27 | 47.20 | 52.00 |
| 9.0% | 31.58 | 33.56 | 35.85 | 38.52 | 41.67 |
| 10.0% | 27.26 | 28.73 | 30.40 | 32.32 | 34.52 |
| 11.0% | 23.85 | 24.98 | 26.25 | 27.67 | 29.28 |
Disclaimer: This calculator is an educational tool. Its output depends entirely on the assumptions you enter and is not investment advice or a recommendation to buy or sell any security.
How this DCF calculator works
A discounted cash flow (DCF) model values a business as the sum of the cash it is expected to generate, with each future amount converted to today's money. This calculator uses a standard two-stage model:
- Project free cash flow. Each forecast year grows from the current figure at your chosen rate:
FCF_t = FCF_0 × (1 + g)^t - Discount each year. Each projected cash flow is divided by one plus the discount rate, compounded for the number of years:
PV = FCF_t / (1 + r)^t - Add a terminal value. Cash flows after the final forecast year are captured with the Gordon growth formula, then discounted back from year n like any other cash flow:
TV = FCF_n × (1 + g_t) / (r − g_t) - Get to a per-share value. The present values add up to enterprise value. Subtracting net debt gives equity value, and dividing by shares outstanding gives intrinsic value per share.
Margin of safety is shown as (intrinsic value − price) ÷ intrinsic value, so a positive figure means the current price is below the estimate.
Limitations
- Small input changes move the answer a lot. The sensitivity grid above shows how far the value per share shifts when the discount rate or terminal growth moves by a point or less. Treat the output as a range, not a single number.
- The terminal value often dominates. Check the "share of value from terminal value" figure. When most of the value sits in the terminal value, the result rests mainly on assumptions about the distant future.
- Constant growth is a simplification. Real cash flows are uneven, and companies with negative or highly cyclical free cash flow are poorly suited to a simple model like this one.
For more on reading the output, see the DCF formula and DCF model explained. If you'd like a structured, AI-assisted walk-through of a specific company, try the AI DCF valuation agent, and read our methodology for how our tools reach their results.
Frequently asked questions
What discount rate should I use in a DCF?
A common starting point is the company's weighted average cost of capital (WACC), which blends the cost of its equity and its after-tax cost of debt. Many investors instead use their own required rate of return. Riskier, less predictable businesses usually warrant a higher rate. Whatever you choose, check the sensitivity grid to see how much the answer depends on it.
What terminal growth rate is reasonable?
Because the terminal value assumes growth forever, the rate is usually kept at or below the long-run growth rate of the economy the company operates in. A terminal rate above that implies the company eventually becomes larger than the economy itself. It must also be below your discount rate, or the formula breaks down.
Why is net debt subtracted from enterprise value?
Discounting free cash flow values the whole business, which belongs to both lenders and shareholders. Subtracting debt and adding back cash (that is, subtracting net debt) leaves the part that belongs to shareholders, which is what a share price represents.
Should I use 5 or 10 years for the forecast?
Five years suits mature, steady businesses. Ten years can be better for companies still growing quickly, since it lets you model that growth before settling into the terminal rate. A longer forecast also tends to reduce how much of the value comes from the terminal value.