EURUSD · technical analysis, levels and trend, updated daily
EUR/USD Forecast Today
This euro dollar forecast shows where EUR/USD closed, the previous day, week and month ranges and today's pivot points that traders mark before the London open, and which way the daily and weekly trend filters point (the last close against its 50-period EMA). It updates once a day from closed candles and describes levels and trend, not a price target.
· next update Sat 24 Oct, 00:20 UTC
1.12165Last close, daily chart (Thu 22 Oct)
- Daily trend: below its 50 EMA
- Weekly trend: below its 50 EMA
Educational, not financial advice. Trading involves risk of loss.
Want a full EUR/USD analysis?
Our Scalper and day-trading bots check EUR/USD for a liquidity sweep, a structure shift and a fresh order block on the 15-minute to 4-hour chart, and return an entry zone, stop and two targets, or a clear HOLD.
Analyse EUR/USD with the botsPlans from $4.99/month. Free to browse what each bot checks.
EUR/USD closed Thursday 22 Oct at 1.12165, after a 1.11893 to 1.12551 range. The daily close is below its 50 EMA (1.13705) and the weekly close is below its 50 EMA (1.14993).
EUR/USD outlook: forecast this week from the trend filters
Not a price target. The direction of the daily and weekly 50-EMA trend filters our bots use, the ranges a sweep would take, and today's pivots.
Both point down, so sell setups are the ones trading with the trend. Last week's range was 1.11140 to 1.12694; these are the levels a sweep this week would take. Today's classic pivot is 1.12203, with R1 at 1.12513 and S1 at 1.11855. September's range was 1.13097 to 1.16538.
EUR/USD technical analysis: key levels today
| Level | High | Low |
|---|---|---|
| Previous day | 1.12551 | 1.11893 |
| Previous week | 1.12694 | 1.11140 |
| Previous month | 1.16538 | 1.13097 |
From UTC daily and Monday-start weekly candles. Your broker's levels can differ slightly if its day ends at 17:00 New York time.
EUR/USD pivot points today
| R3 | 1.13171 |
|---|---|
| R2 | 1.12861 |
| R1 | 1.12513 |
| Pivot | 1.12203 |
| S1 | 1.11855 |
| S2 | 1.11545 |
| S3 | 1.11197 |
Classic pivots from yesterday's candle. Camarilla, Fibonacci, Woodie and weekly pivots are on the pivot point calculator.
EUR/USD live chart
Live price on the 15-minute chart, to compare with the levels above.
EUR/USD live chart
Chart by TradingView
How to read this euro dollar forecast
Everything on this page comes from closed candles: yesterday's, last week's and last month's high and low, the classic pivot points, and whether the last daily and weekly closes sit above or below their 50-period exponential moving average. Those are the reference points most EUR/USD traders mark before the London open. Nothing here predicts the next move.
What drives the euro dollar rate (EUR/USD)
EUR/USD moves mostly on the gap between what markets expect from the European Central Bank and the Federal Reserve. US releases (CPI inflation, the monthly jobs report, Fed meetings) and eurozone inflation and PMI surveys cause the biggest daily ranges. It is the most traded currency pair, so spreads are tight and it trades actively through the London session and the London–New York overlap.
Ranges, sweeps and the trend filter
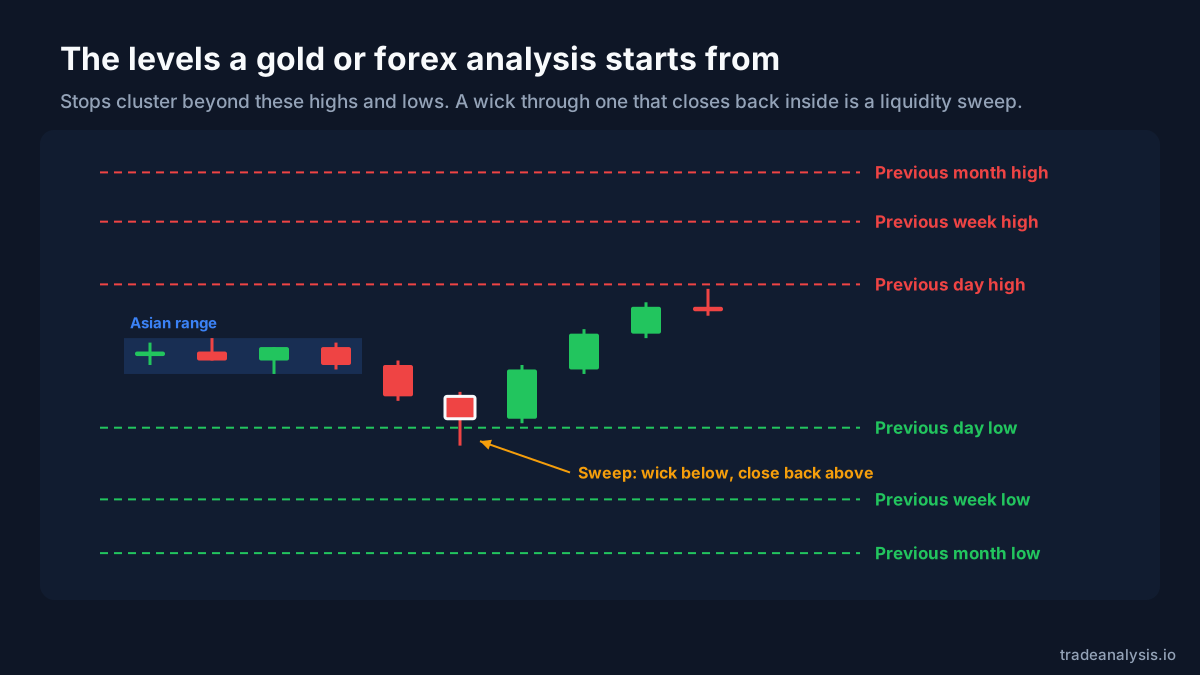
The previous day's and week's highs and lows are where many traders leave stop orders. A move through one of them that closes back inside is a liquidity sweep, the first step in the rules our bots follow. The bots only take setups in the direction of their higher-timeframe trend filter, the same 50-EMA test shown at the top of this page. Their full rules are on the methodology page, and the session times guide covers when London and New York are open.
If you trade a level, size the position from your stop: a pip on EUR/USD is 0.0001, worth $10 per standard lot. The risk reward calculator checks whether the target is worth the stop, and how to calculate lot size walks through the arithmetic.
More free trading tools
EUR/USD forecast FAQ
Is this a EUR/USD prediction?
How often is the EUR/USD forecast updated?
What moves EUR/USD the most?
How much is a pip on EUR/USD?
Educational, not financial advice. Trading involves risk of loss.