On this page
A liquidity sweep is a quick move through an obvious high or low, where many stop orders are likely sitting, followed by price closing back on the other side of that level. The wick pokes through, the orders get triggered, and the candle closes back inside the old range. Traders also call it a liquidity grab or a stop hunt.
The idea comes from smart money concepts (SMC), a chart-reading framework covered in our smart money concepts overview. This guide explains what a sweep is, why it tends to happen at certain levels, and how to tell it apart from a real breakout. It does not claim that trading sweeps gives you an edge. Nobody has shown that in a way that holds up, and different traders draw the same idea in different ways.
What does "liquidity" mean here?
In this context, liquidity means resting orders: stop-losses, breakout entries and limit orders waiting at a price. When a lot of traders put their stops in the same place, that price holds a cluster of orders.
A stop-loss on a long position is a sell order. A stop-loss on a short position is a buy order. So a cluster of stops is also a cluster of market orders waiting to be triggered. Someone who wants to buy a large amount needs sellers, and a pool of sell stops below a low is one place to find them.
That is the logic of a sweep: a story about where orders sit, not a forecast.
Why do stops cluster at obvious highs and lows?
Most traders are taught to place stops just beyond a recent high or low. Because so many people read the same chart, the same levels keep getting picked. The usual places are:
- Previous day high and low. A standard reference for day traders.
- Previous week high and low. Swing traders and position traders watch these.
- Asian session range. The high and low printed during the quieter Asian hours, before London opens, are a common reference for intraday traders in forex and gold.
- Equal highs or equal lows. Two or three swing points at nearly the same price look like strong support or resistance, which invites stops just beyond them.
Buy-side liquidity vs sell-side liquidity
SMC traders split liquidity into two pools.
| Buy-side liquidity | Sell-side liquidity | |
|---|---|---|
| Where it sits | Above highs | Below lows |
| What orders are there | Buy stops from short sellers, buy-stop breakout entries | Sell stops from buyers, sell-stop breakout entries |
| A sweep looks like | A wick above the high, close back below it | A wick below the low, close back above it |
| What SMC traders then look for | A possible move down | A possible move up |
A sweep of sell-side liquidity is often read as a possible bullish setup, because the sell orders below the low have been filled. A sweep of buy-side liquidity is the mirror. "Possible" is doing a lot of work in that sentence. A sweep on its own tells you very little.
Liquidity sweep vs breakout: what's the difference?
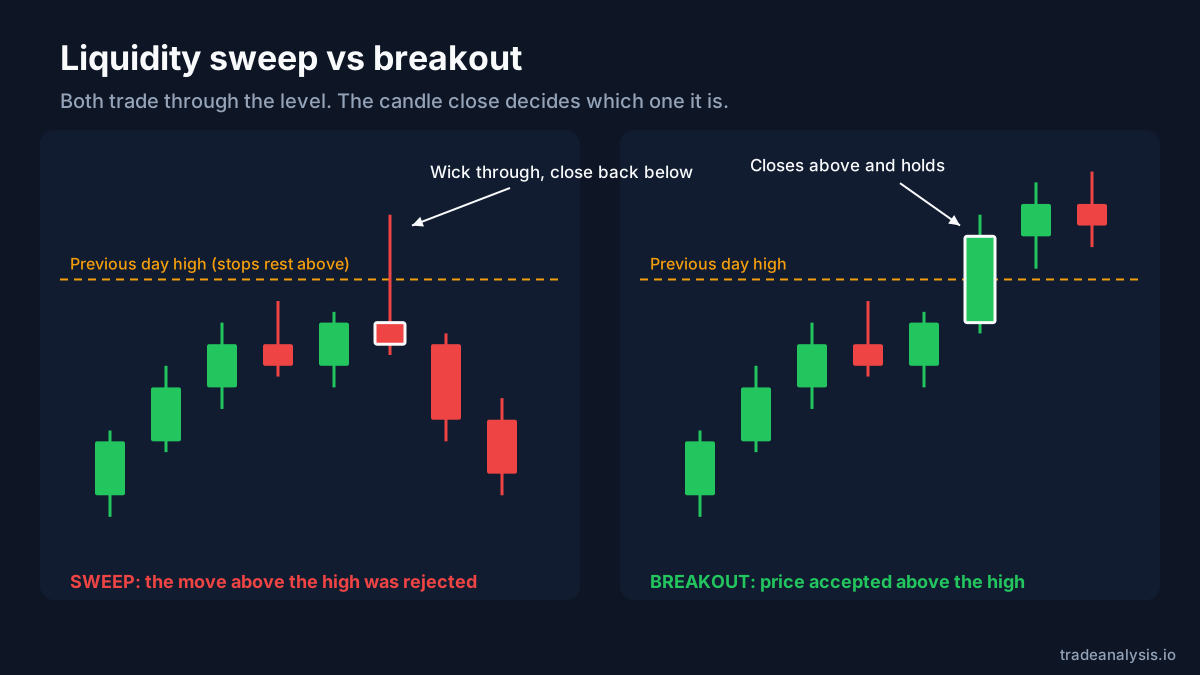
This is the question that matters most, because a sweep and a breakout start the same way. Price trades through a level in both. The difference is what happens at the close.
- Sweep: the candle wicks through the level and closes back inside it. The market rejected the new price.
- Breakout: the candle closes beyond the level, and the following candles stay there. Traders call this acceptance.
| Liquidity sweep | Breakout | |
|---|---|---|
| Wick through the level | Yes | Yes |
| Candle close | Back inside the level | Beyond the level |
| Next few candles | Move away from the level | Hold beyond the level |
| What it suggests | The move through the level was rejected | Price accepted the new area |
Using the close, not the wick, is what makes a sweep definable. Without that rule, almost any move through a level can be called a sweep in hindsight.
How do you spot a liquidity sweep?
A simple, repeatable checklist:
- Mark the level before it is hit. Previous day high and low, the Asian session range, previous week high and low. Drawing levels after the fact is how people fool themselves. For gold, the gold analysis today page lists these levels for the current session and marks which have been swept.
- Wait for a candle to trade through it. A wick beyond the level is required.
- Wait for that candle to close. If it closes back inside, you have a sweep by this definition. If it closes beyond, it is not a sweep.
- Look for what comes next. On its own a sweep is just one candle. SMC traders usually want a follow-up, such as a break of structure or change of character in the opposite direction. Some also want the move away to leave a fair value gap.
Common mistakes with liquidity sweeps
- Calling every wick a sweep. Wicks happen all the time. If the level was not one you had marked beforehand, it probably is not one many others had marked either.
- Trading the sweep alone. A sweep followed by more price in the same direction is just a breakout that you faded. Most SMC traders want some confirmation first.
- Ignoring the bigger trend. A sweep of a low in a strong downtrend often turns out to be a pause, not a turn.
- Using intrabar prices. Deciding on an open candle means the "sweep" can disappear before the close.
How our bots use this
All four TradeAnalysis bots run the same fixed SMC rules as code. No AI model and no news decides buy, sell or hold. A liquidity sweep is step one of those rules, and the levels each bot watches depend on its timeframe:
| Bot | Setup chart | Trend filter | Levels watched | Sessions |
|---|---|---|---|---|
| Scalper | 15-minute | 4-hour | Previous day, Asian session | London and New York only |
| Basic Day | 1-hour | 4-hour | Previous day, Asian session | London and New York only |
| Advance Day | 4-hour | Daily | Previous day, previous week | Any |
| Swing | Daily | Weekly | Previous week, previous month | Any |
A BUY or SELL needs all of these, in order:
- A liquidity sweep: a candle wicks through one of those levels and closes back inside it.
- A structure shift: within 12 candles, price closes beyond the last swing point in the opposite direction to the sweep.
- A return to the order block: the order block is the last opposite-coloured candle before that shift, and the signal fires on the first candle that comes back into it.
- The trend agrees: the last closed higher-timeframe candle is above its 50-period EMA for a buy, below it for a sell.
- The session fits: Scalper and Basic Day only signal in London (07:00–10:00 UTC) and New York (12:00–16:00 UTC). Gold may also signal outside those windows, but capped at Medium confidence and labelled as such.
In India (IST, UTC+5:30) those windows are 12:30–15:30 and 17:30–21:30 all year. In New York time they move with daylight saving: during US daylight time (EDT, UTC−4) they are 03:00–06:00 and 08:00–12:00; in winter (EST, UTC−5) they are 02:00–05:00 and 07:00–11:00. US clocks change on the second Sunday in March and first Sunday in November. London local time is the same as UTC in winter and an hour ahead during British Summer Time, with UK clocks changing on the last Sunday in March and October.
If any step is missing, the answer is HOLD. The stop sits just beyond the sweep wick plus 0.1× ATR. Gold on Scalper and Basic Day has two targets of 100 pips ($10) and 200 pips ($20) from the zone edge; everything else uses 1× and 2× the risk. Only closed candles are used, so the same candles always give the same answer. The full rules are on our methodology page. We do not publish performance figures for these bots.
FAQ
Is a liquidity grab the same as a liquidity sweep?
Yes, in most usage the two terms mean the same thing. Some traders use "grab" for a sharp single-candle move and "sweep" for any move through a level that closes back inside, but there is no fixed standard.
What is the difference between a stop hunt and a liquidity sweep?
They describe the same price action. "Stop hunt" implies someone deliberately pushed price to trigger stops, which you cannot see on a chart. "Liquidity sweep" just describes what happened: price traded through a level and closed back inside.
Which timeframe is best for spotting liquidity sweeps?
There is no single best one. Sweeps of the previous day or Asian session range are usually read on 15-minute to 1-hour charts, while weekly and monthly levels suit 4-hour and daily charts. The higher the timeframe, the fewer sweeps you will see.
Does a liquidity sweep mean price will reverse?
No. A sweep only tells you one candle closed back inside a level. Price can and often does continue in the original direction, which is why most SMC traders wait for a structure shift before acting.
This is educational content, not financial advice.
Written by
Pranav, Founder of TradeAnalysis
After five years in trading and research, Pranav built TradeAnalysis to bring multi-angle analysis to individual traders. About us
Educational content, not financial advice. Trading involves substantial risk of loss. Full risk disclaimer.